This section contrasts between the food pairing scores calculated for 4 random controls for all 22 regions of the world.
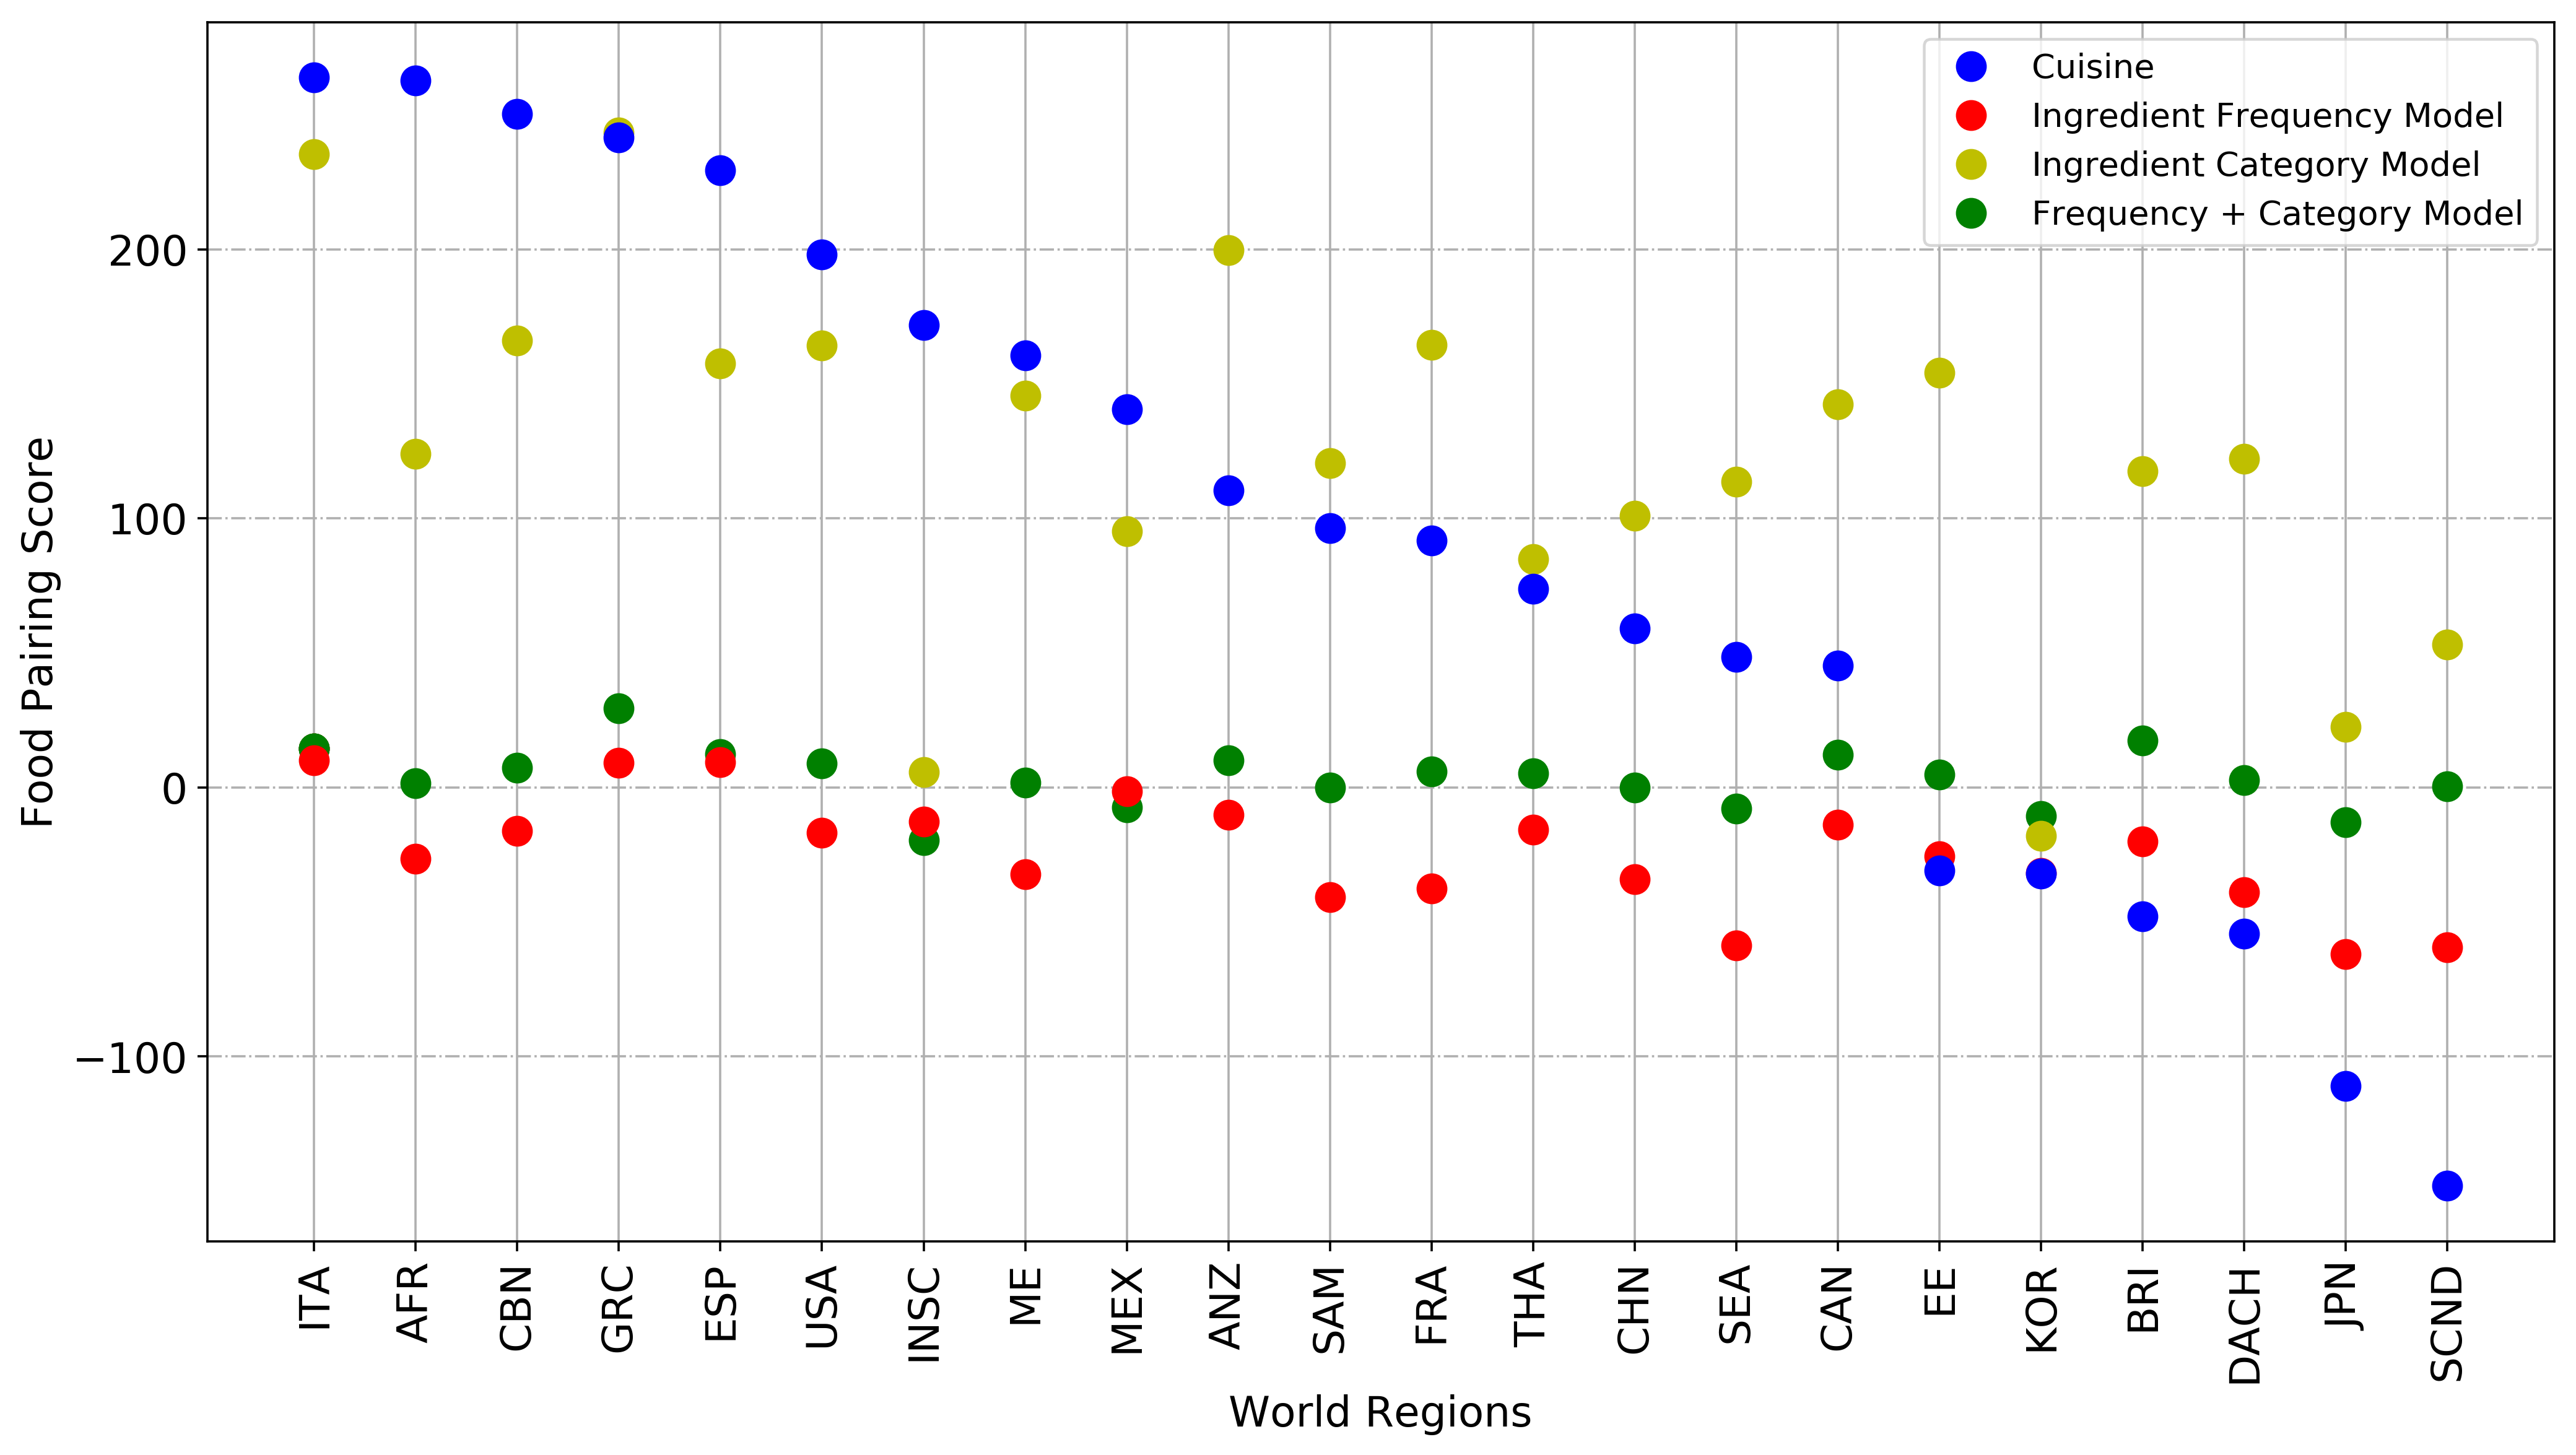
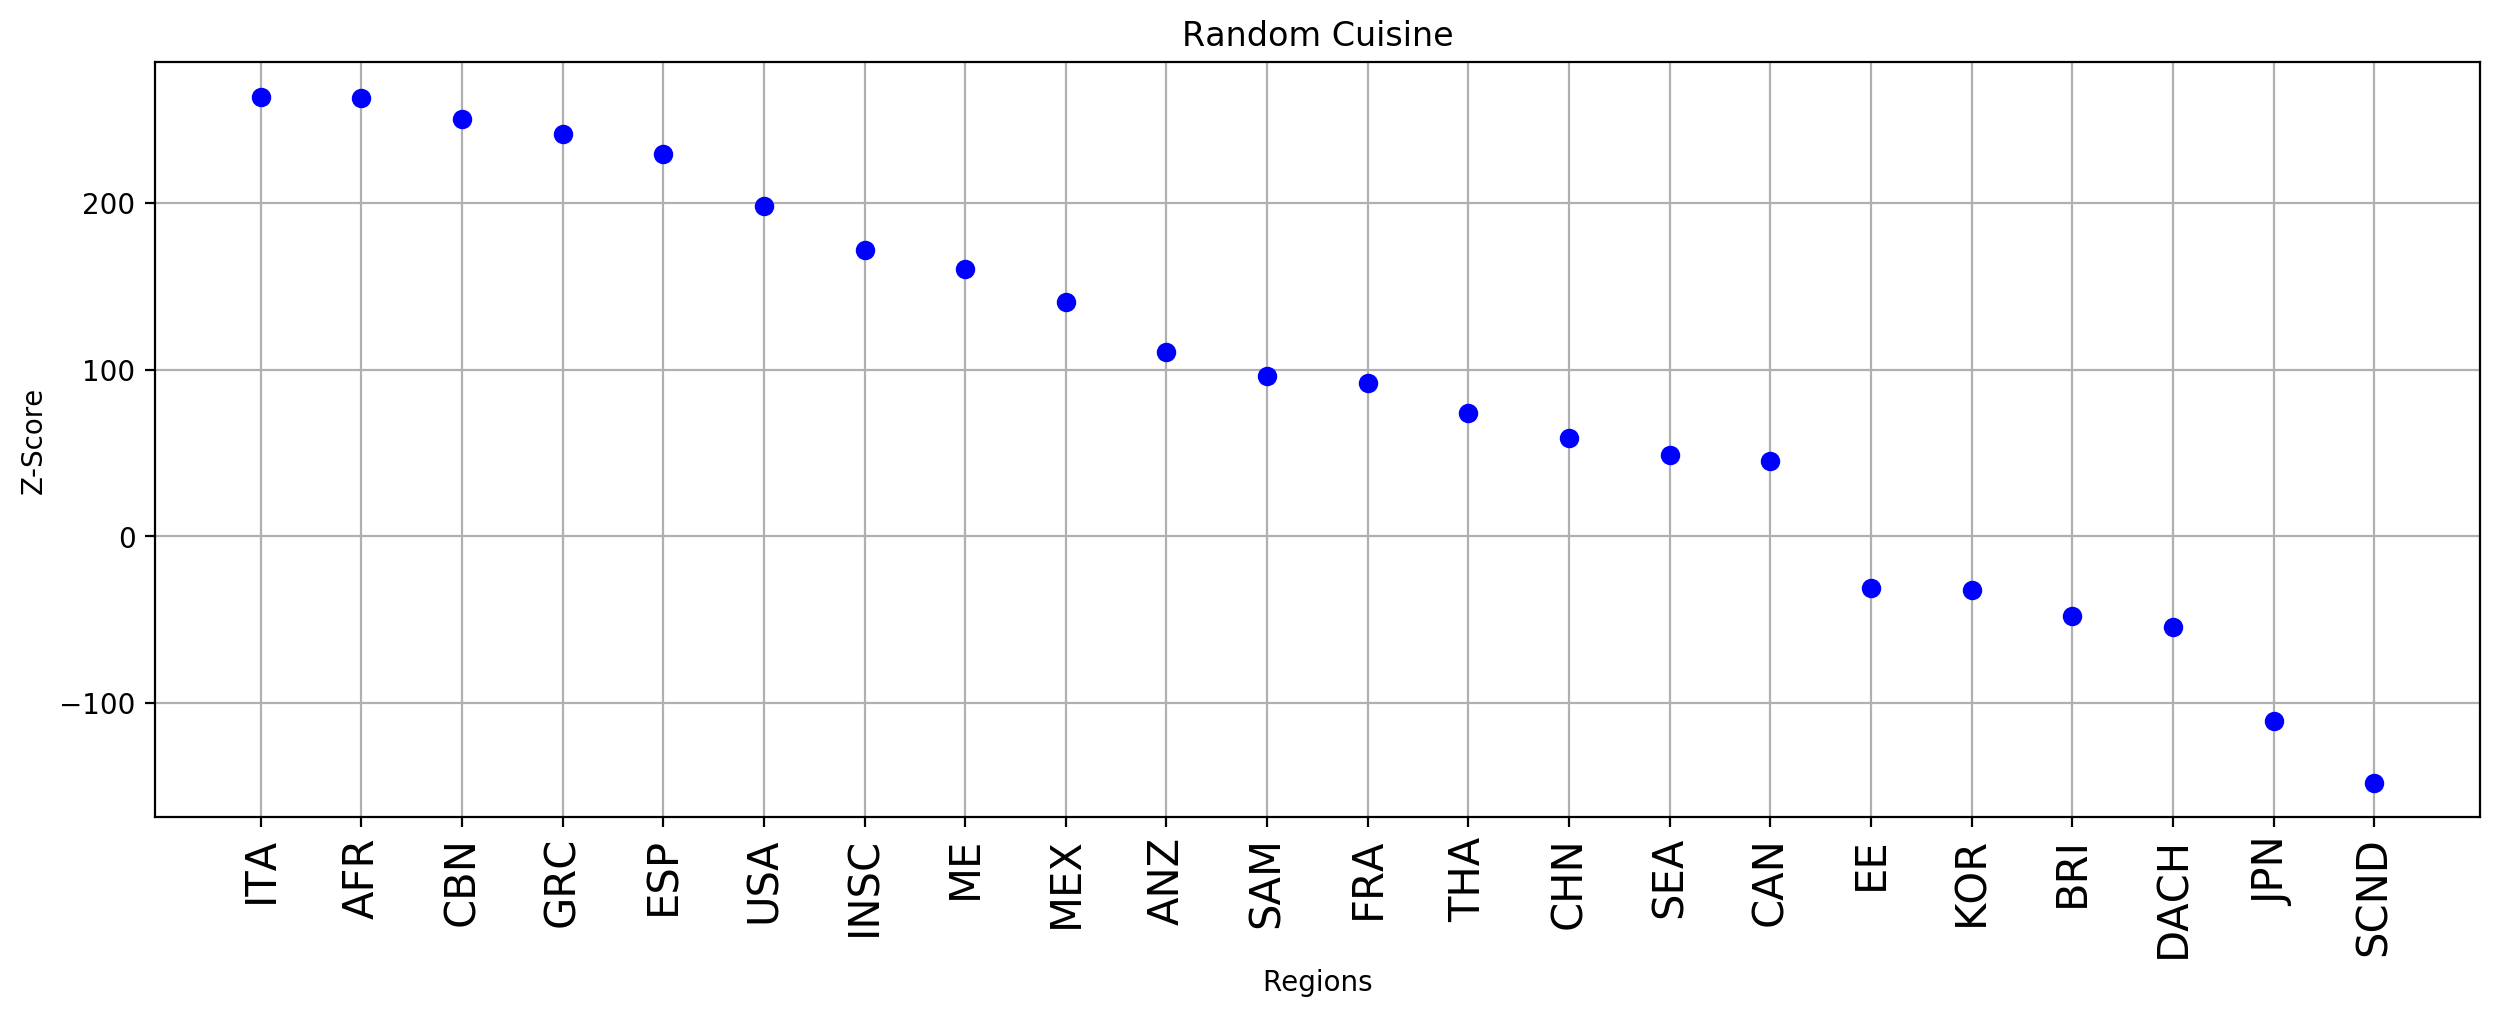
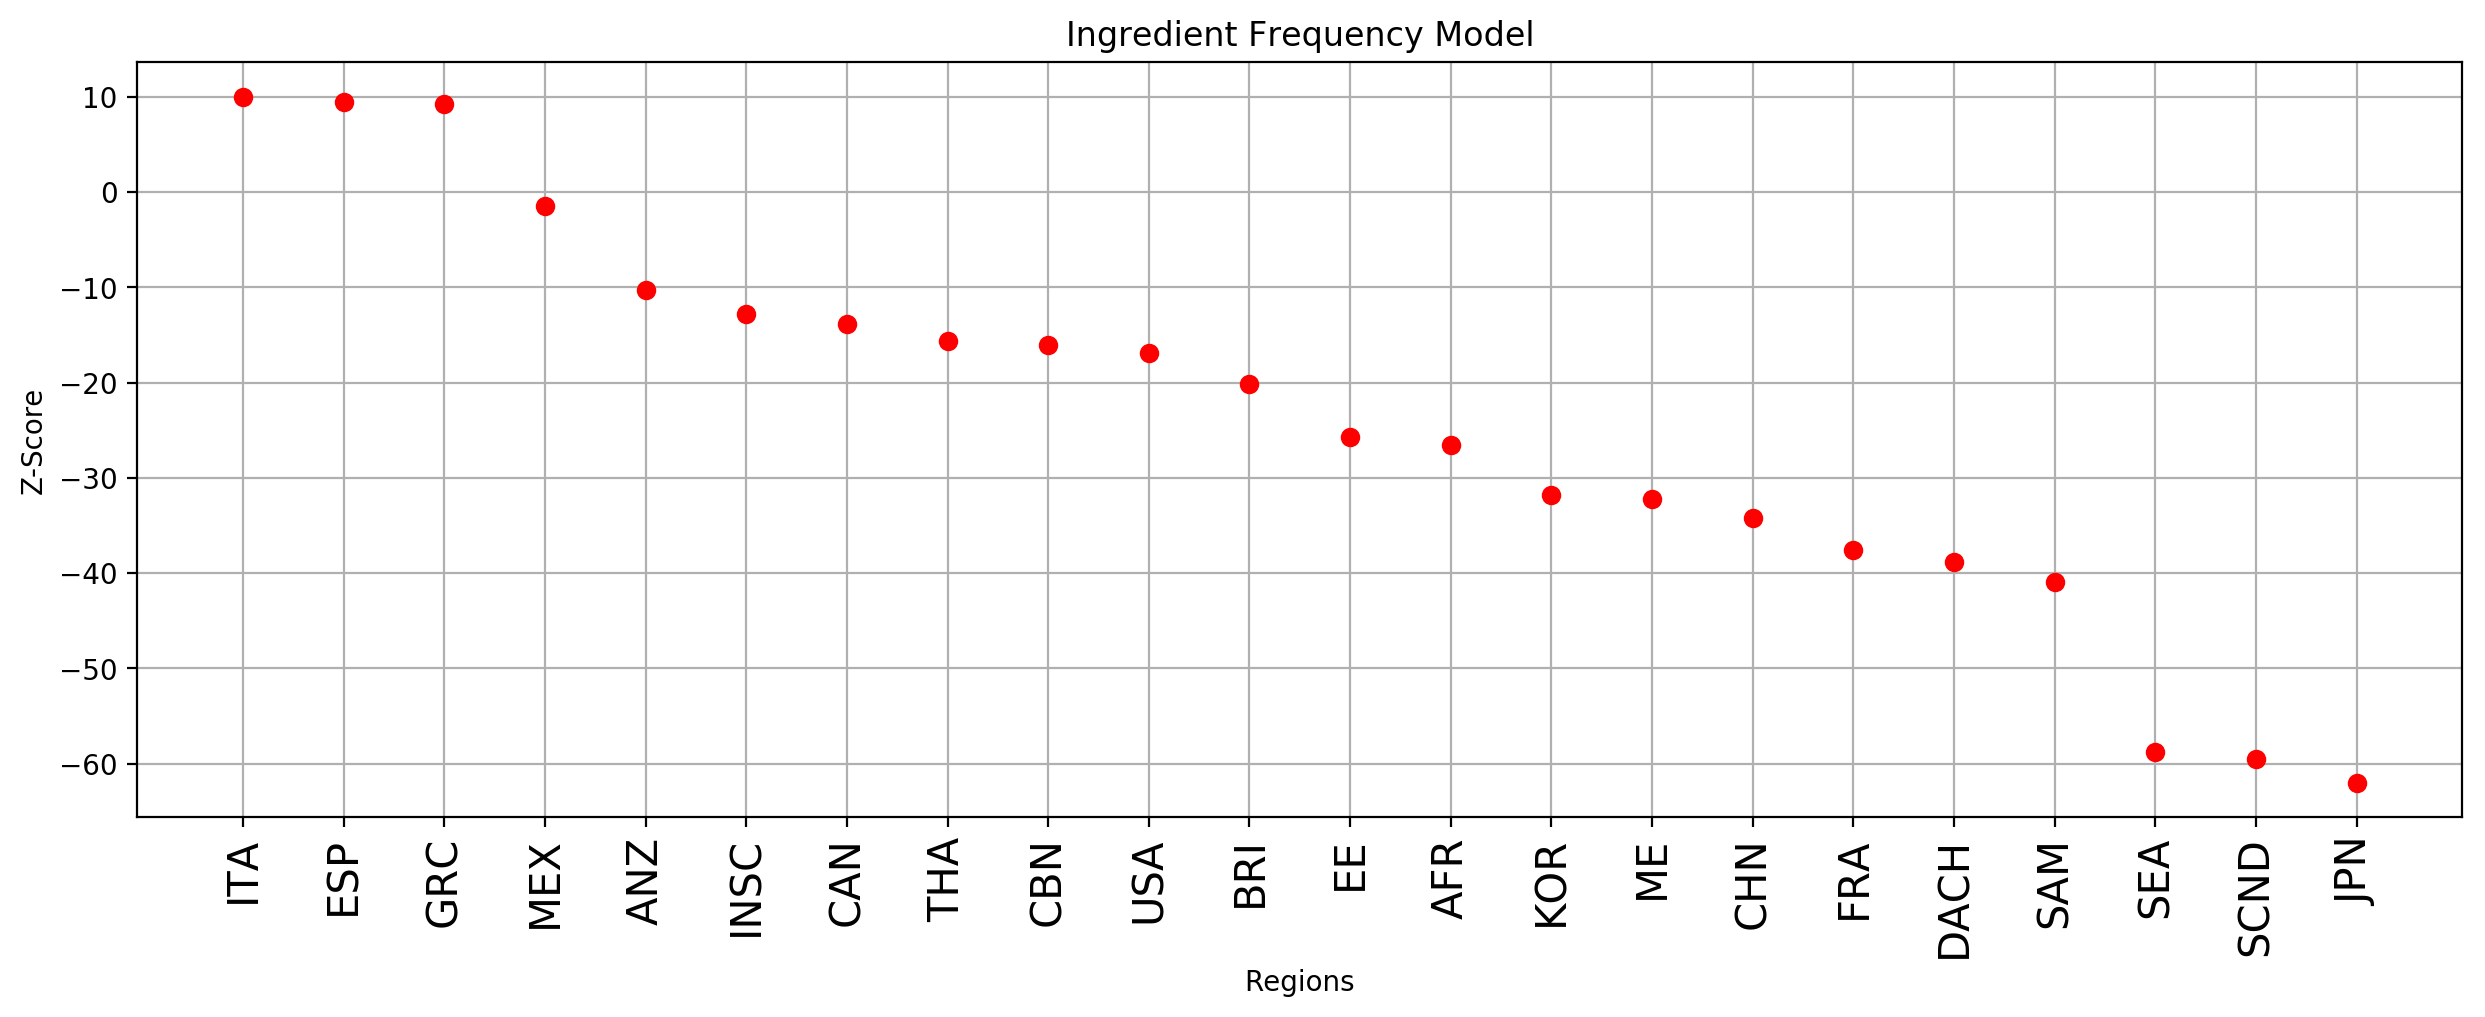
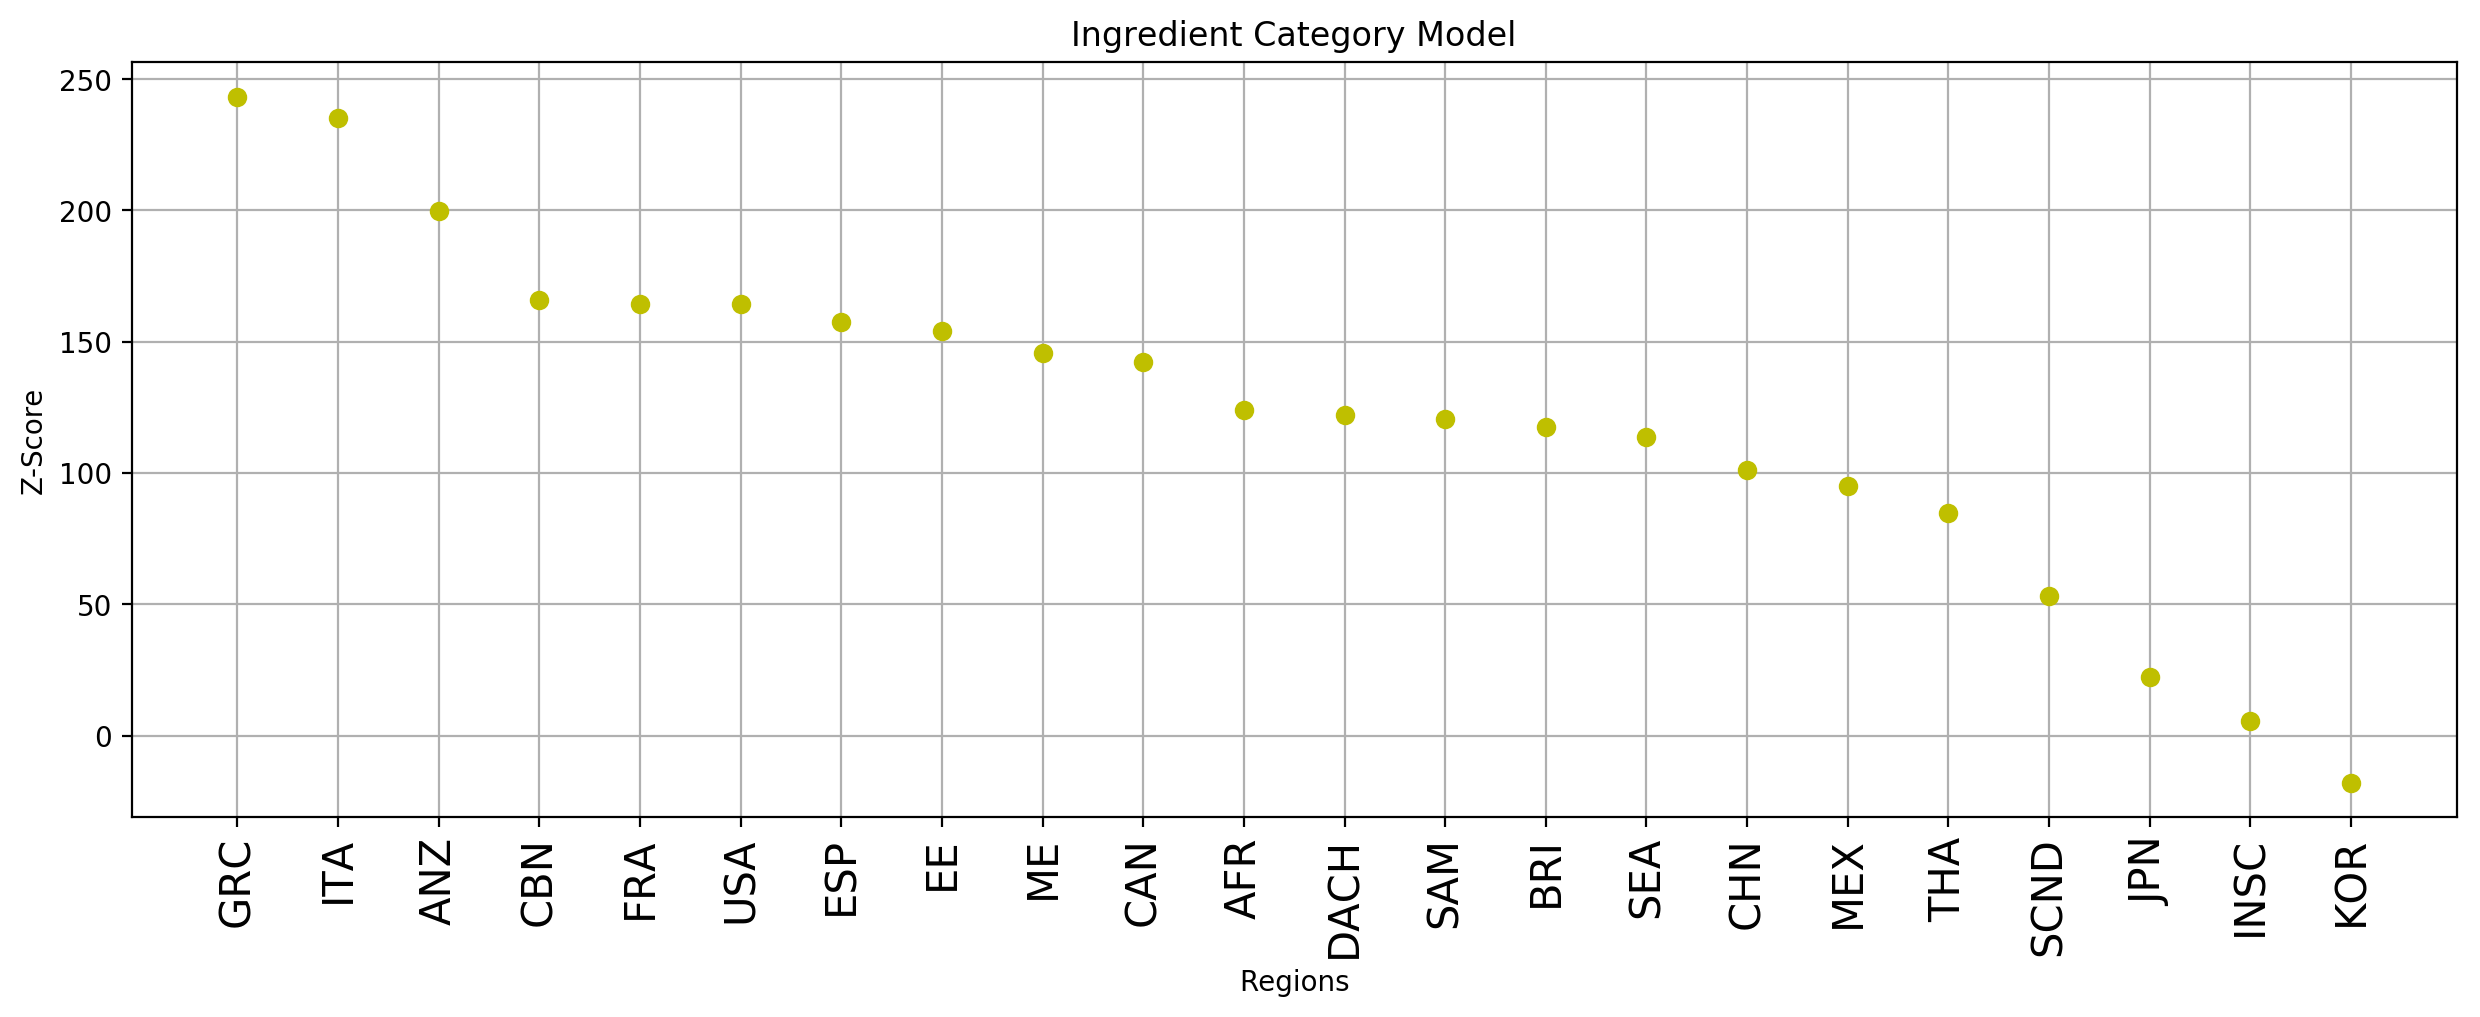
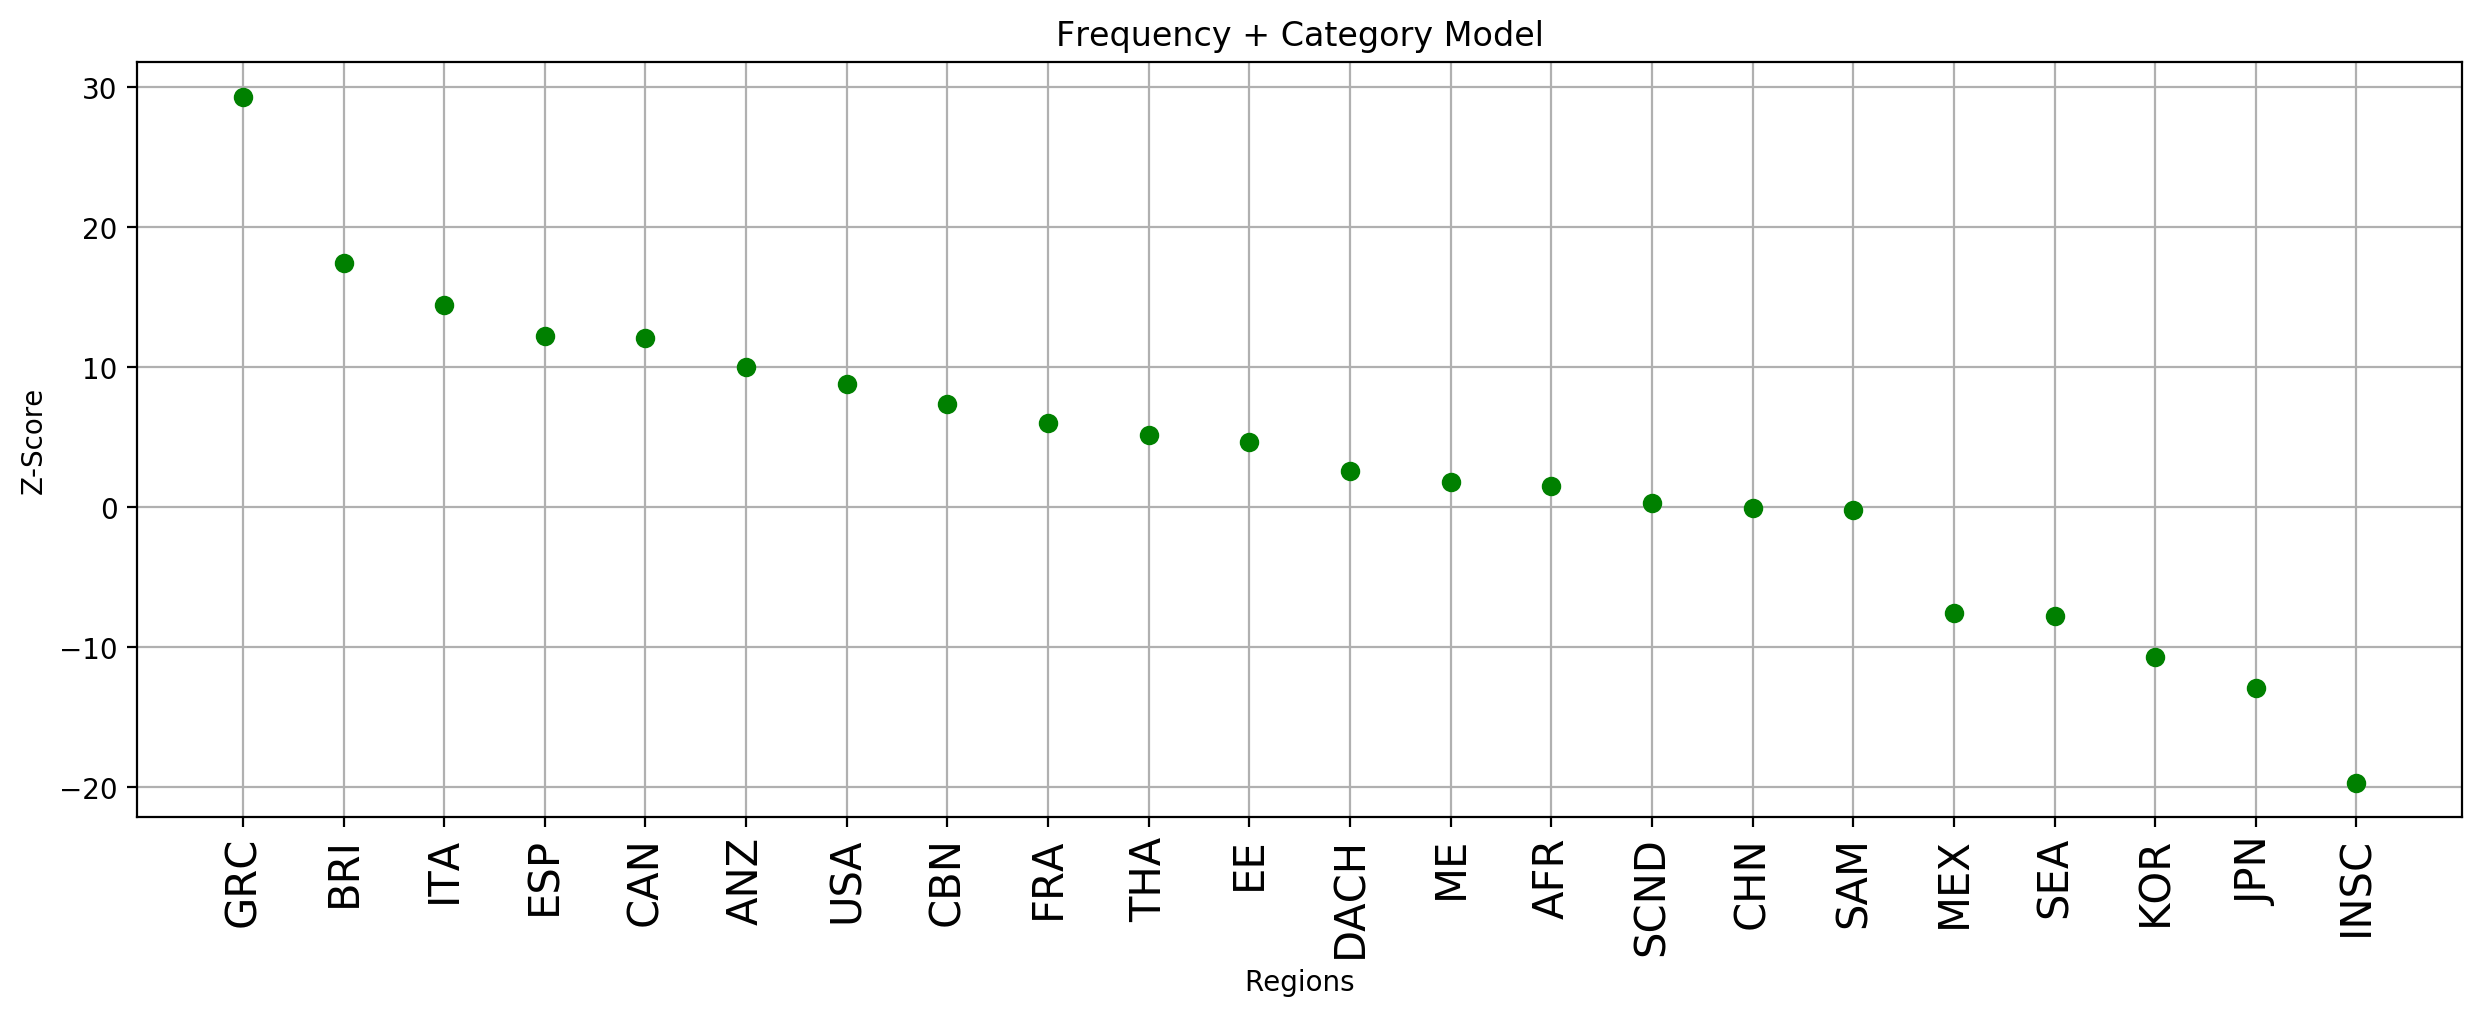
This section contrasts between the food pairing scores calculated for 4 random controls for all 22 regions of the world.
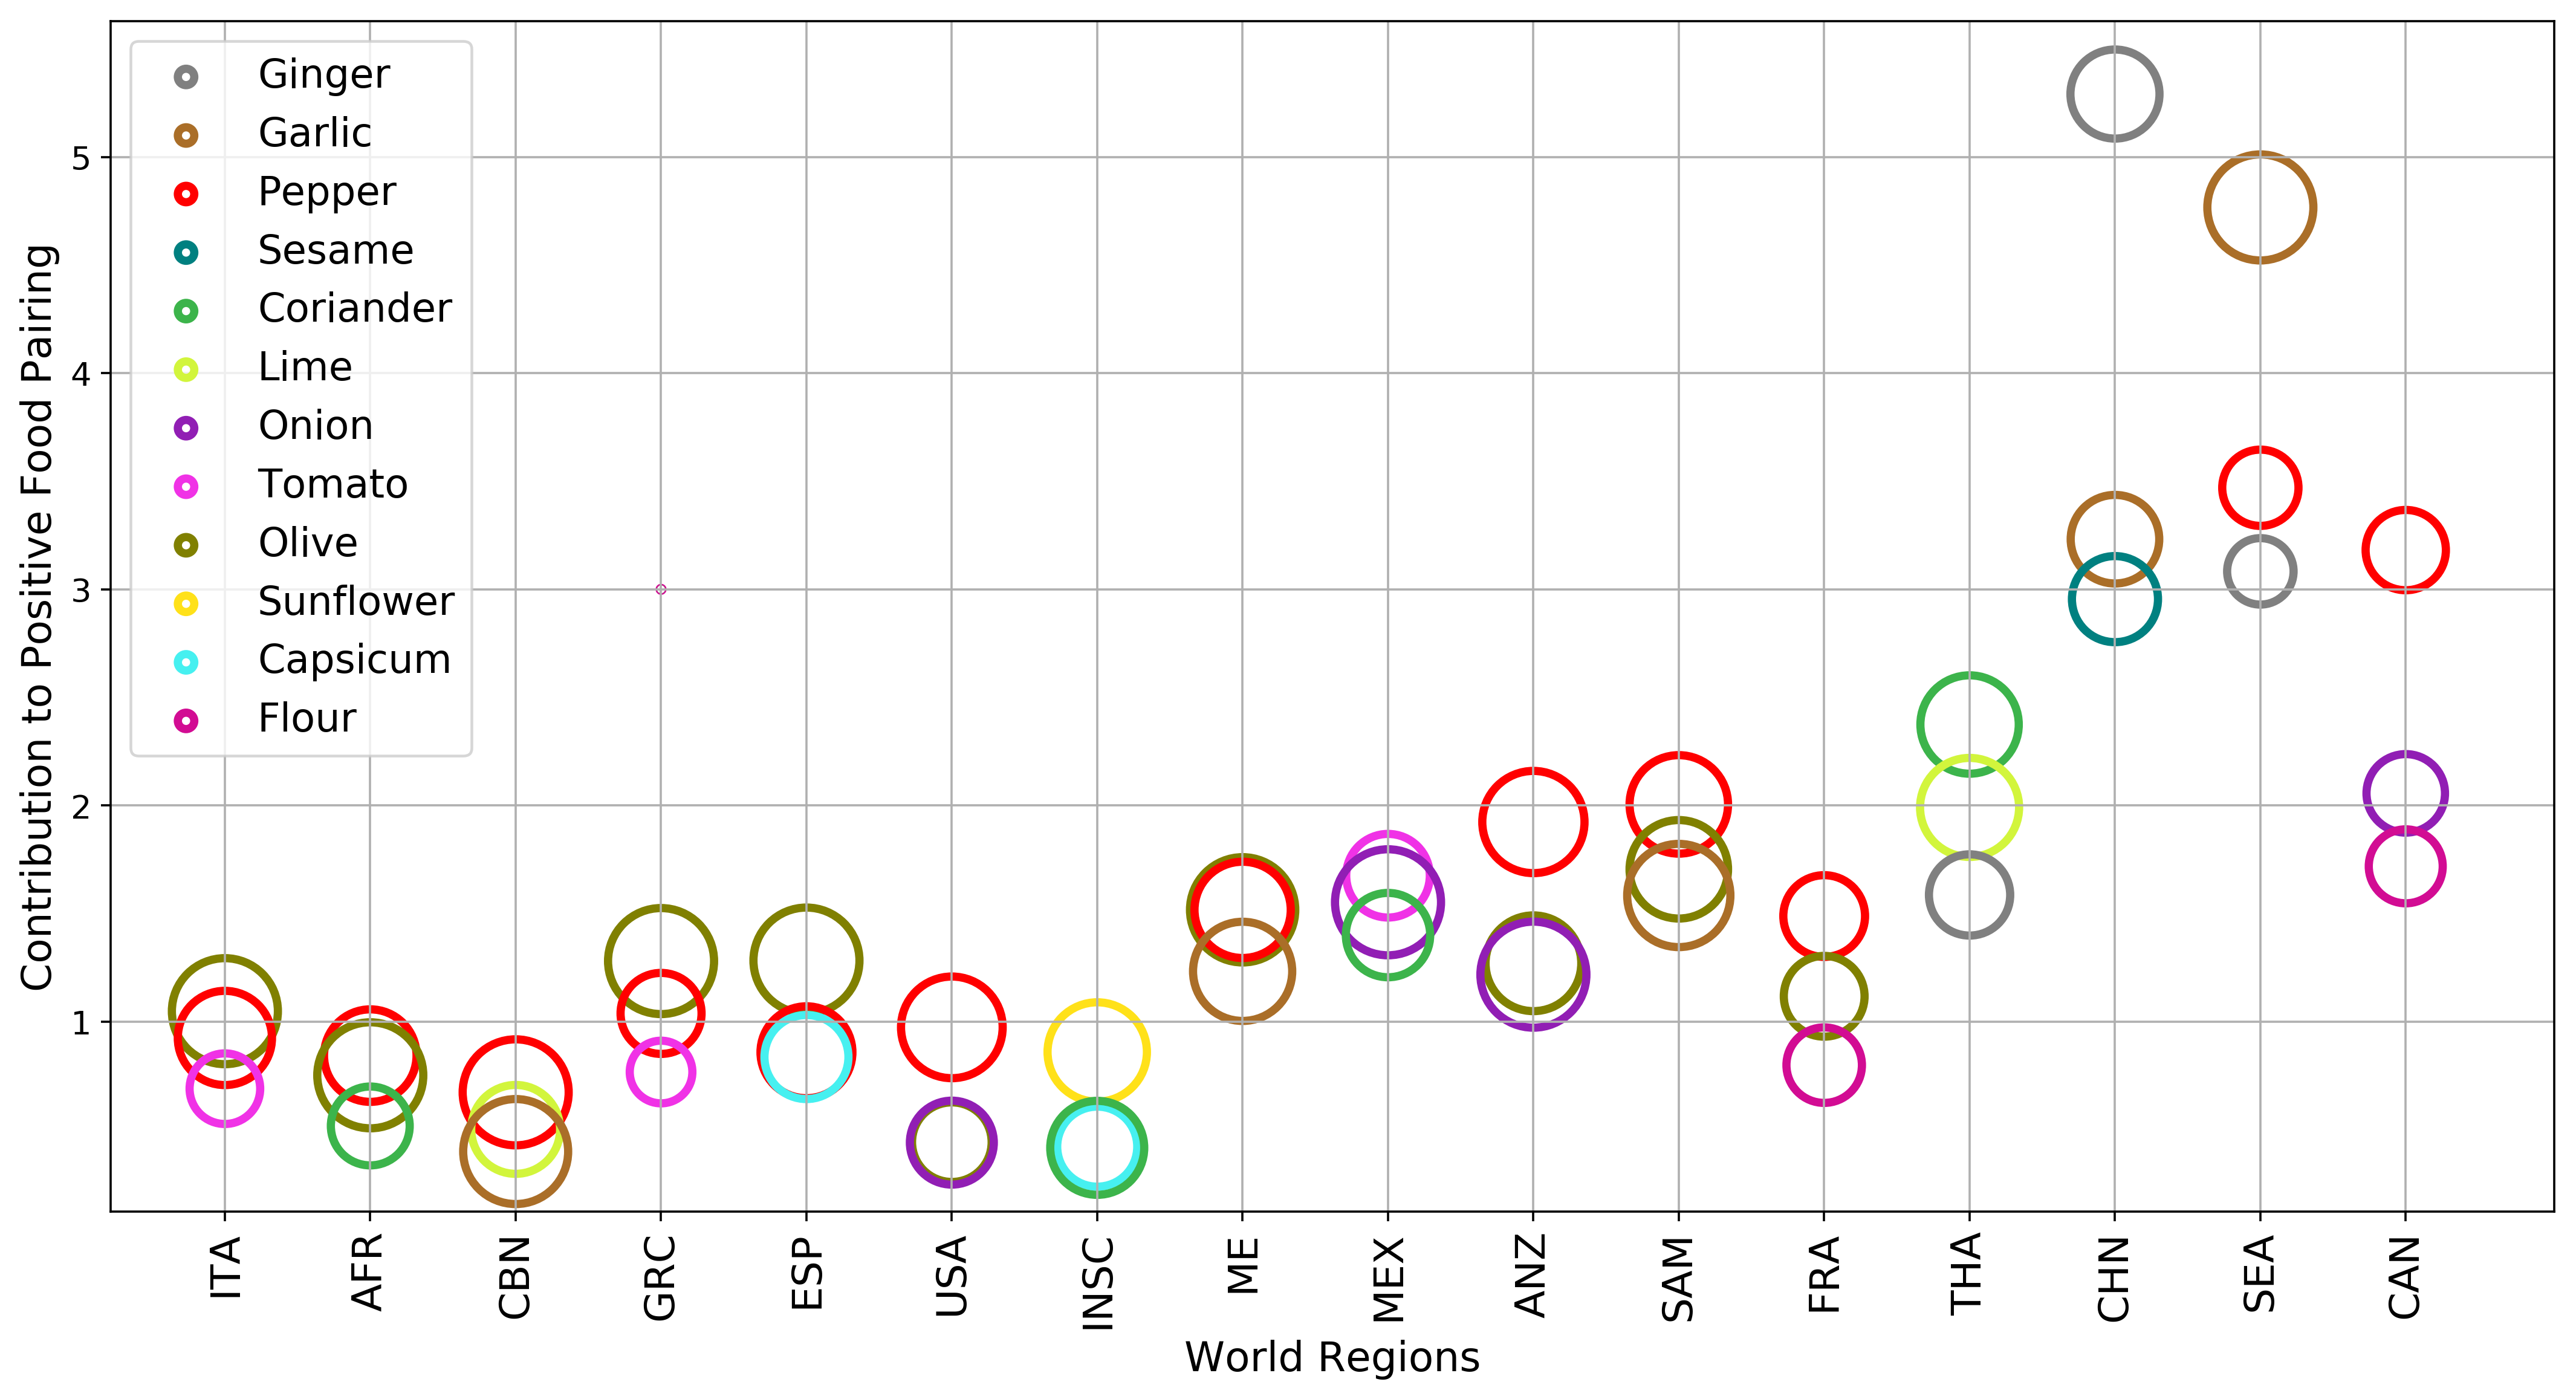
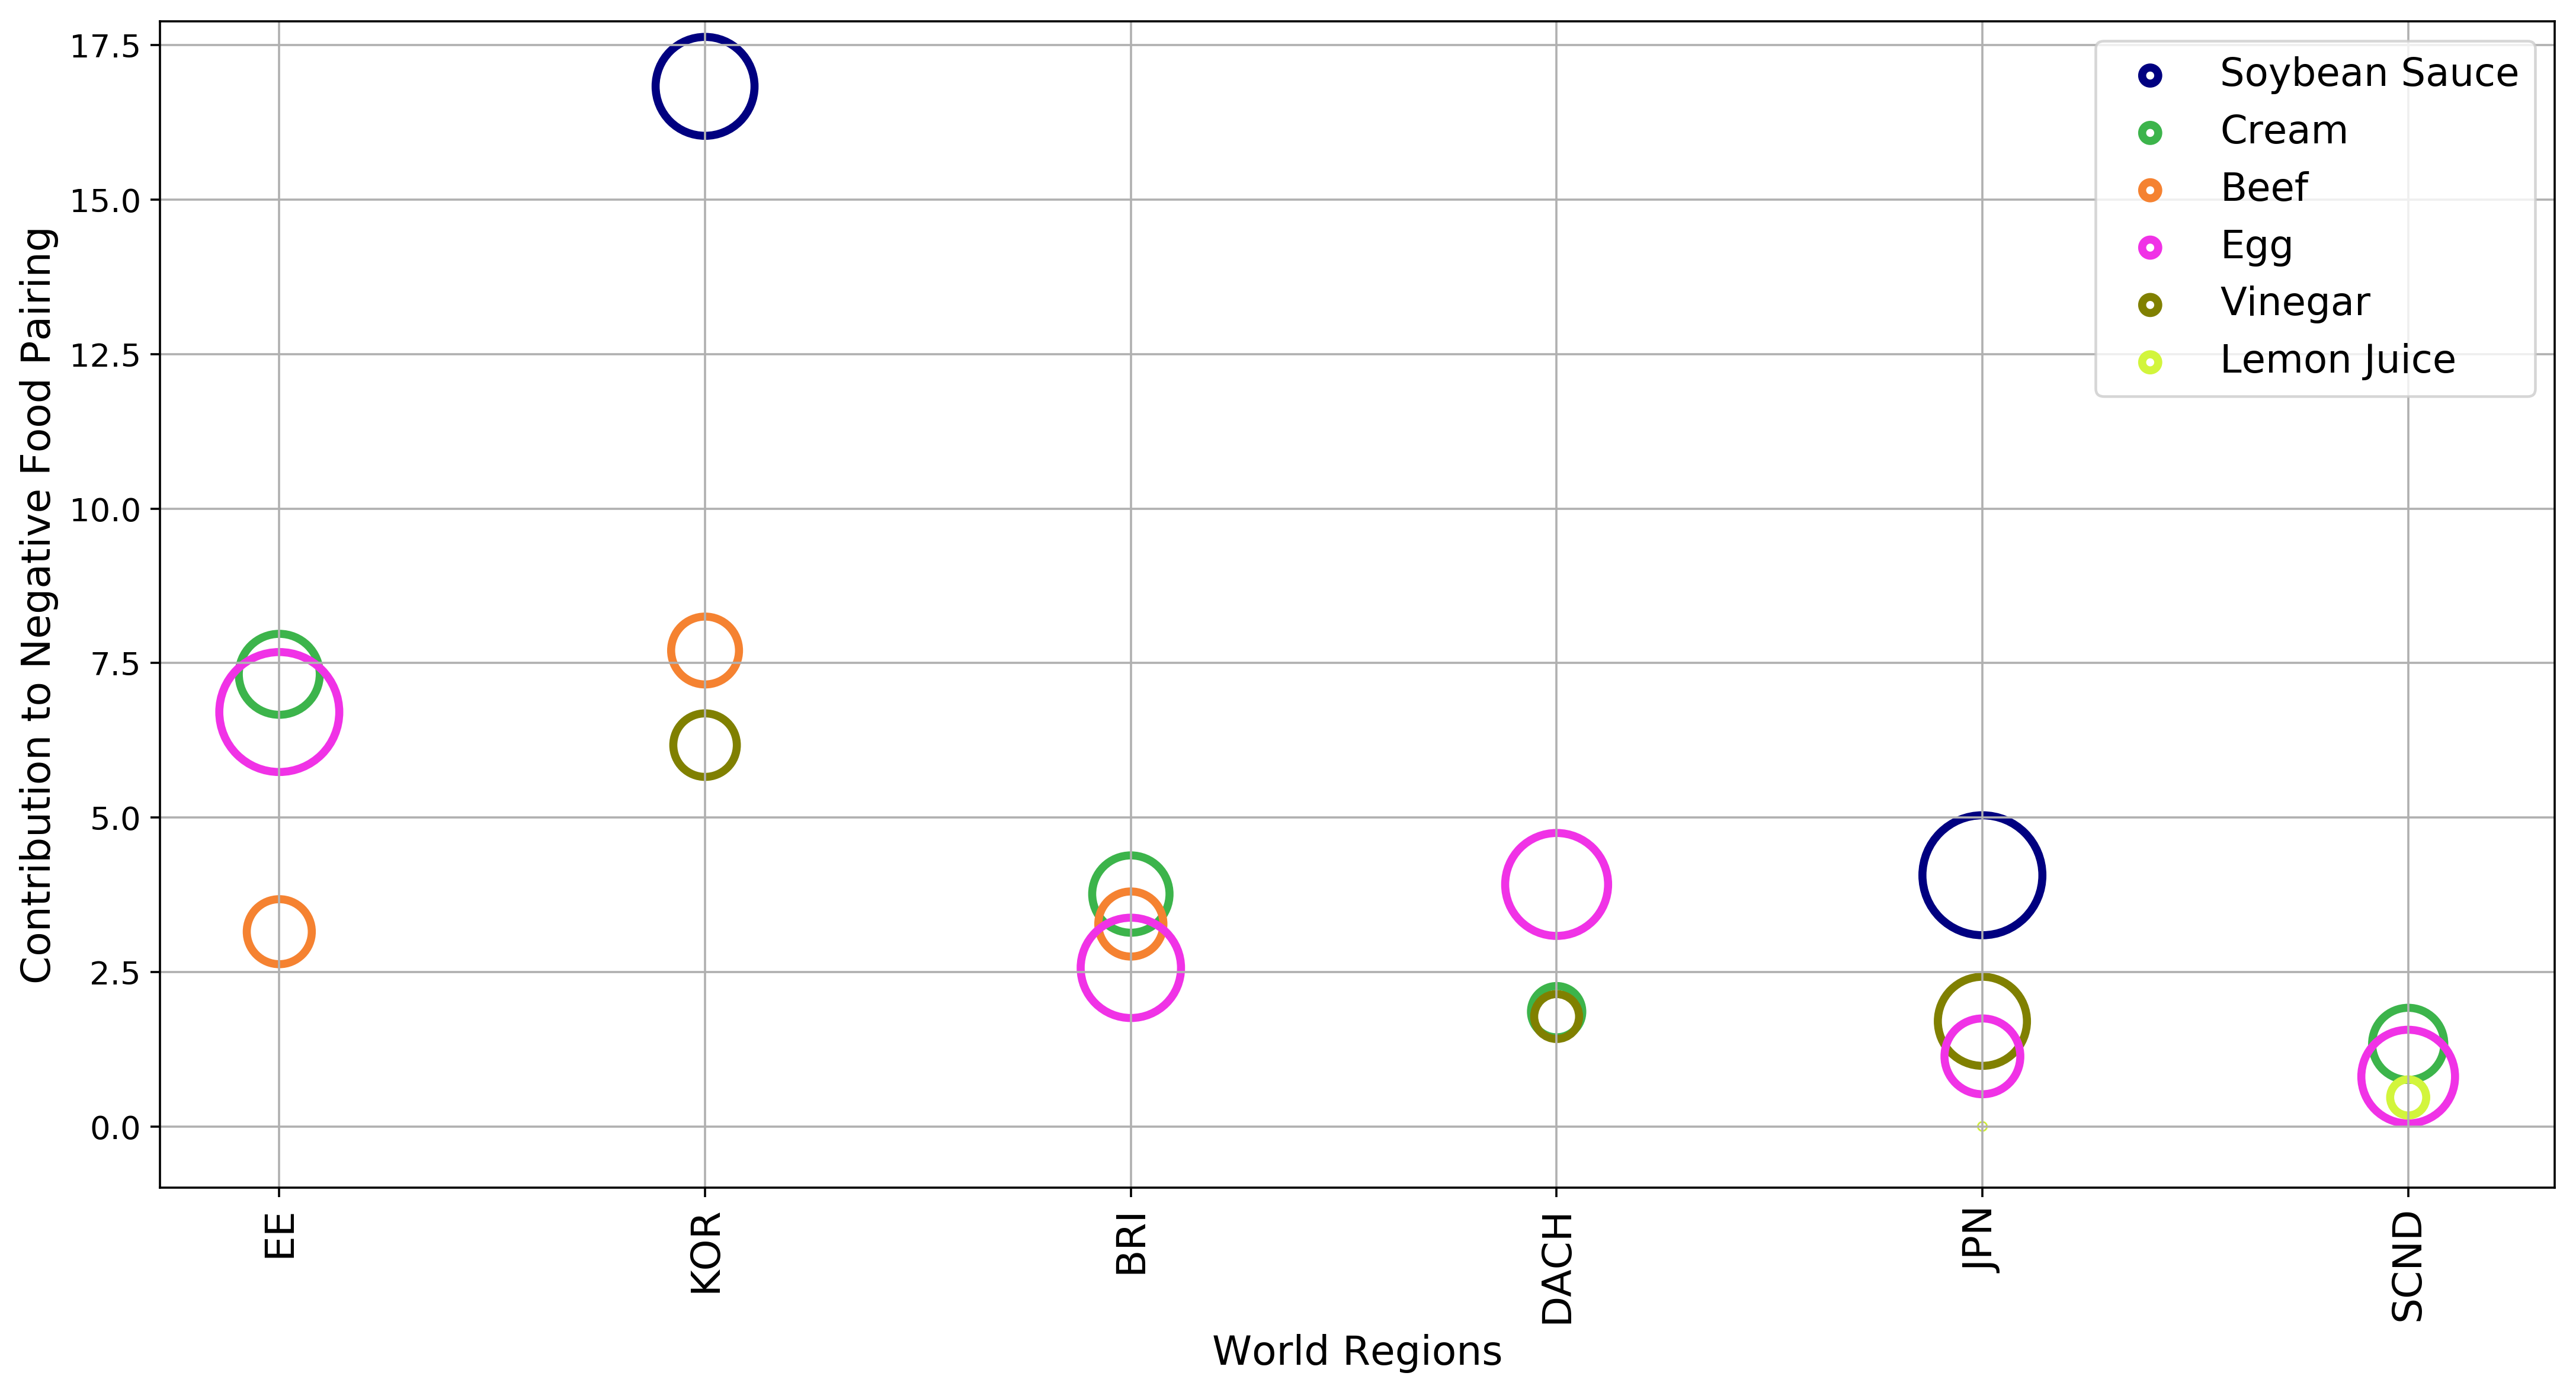
This section enunciates top 5 ingredients contributing to the positive and negative food pairing to cuisines with dominance of uniform or contrasting blend, respectively.