Flavor Molecules Search
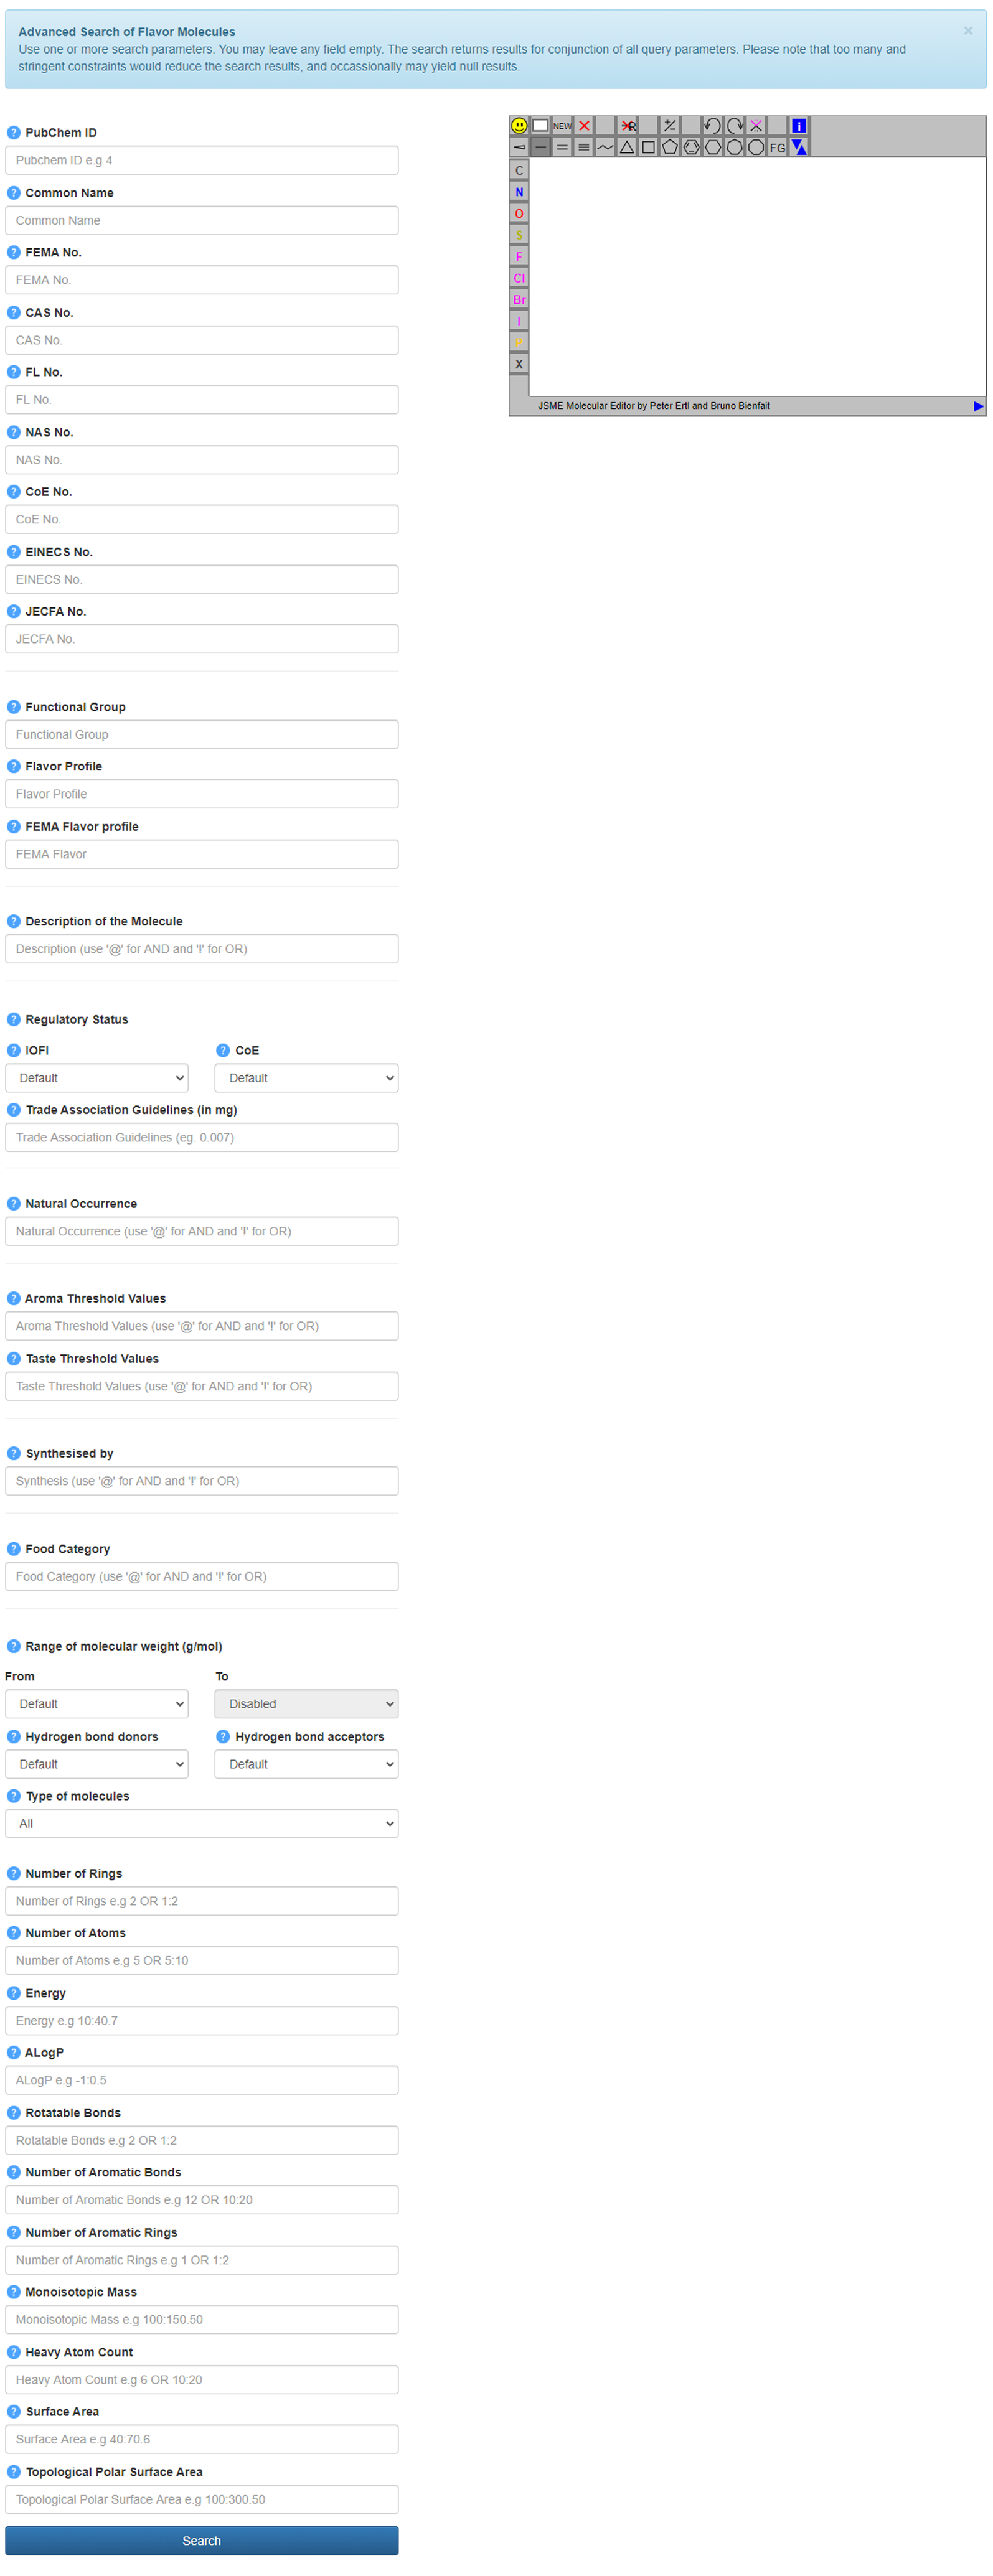
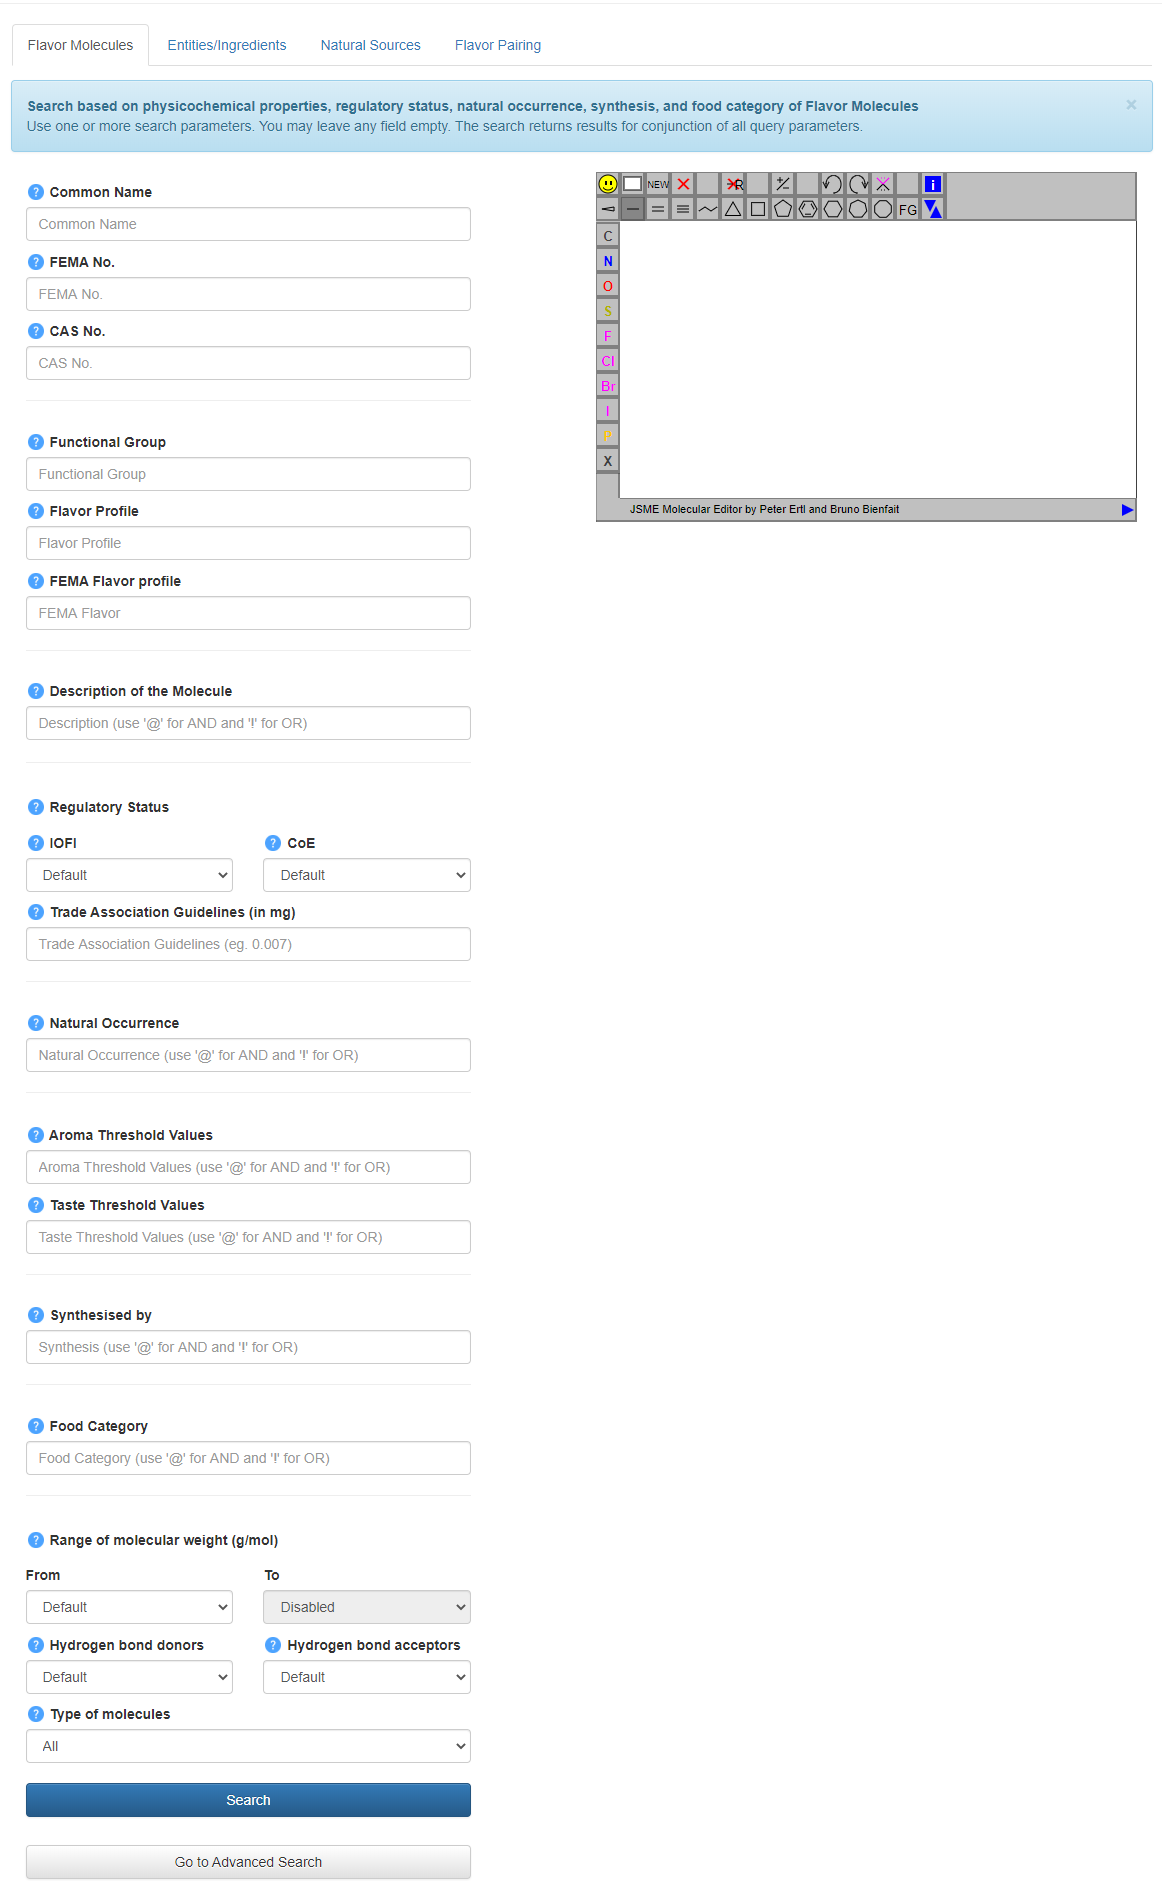
As part of main search tool, ‘Flavor Molecules’ search facilitates querying and browsing FlavorDB on the basis of a host of features: Common Name, Functional Group, FEMA Flavor Profile, Flavor Profile Molecular Weight, Number of Hydrogen Bond Donor/Acceptors, Type of Molecules (Natural, Synthetic, Source Unknown). Apart from that one could use JSME Molecular Editor for generating a query by drawing a structure of a molecule. Other than hand-drawing the structure, one could also paste SMILES or upload Mol or SDF files.
This search allows conjunction of all the query parameters provided. Therefore the query could be refined by using multiple constraints. The search generates the Results page listing all flavor molecules in the database that fulfil the criteria.
In case you are not looking for anything specific, just hit the ‘Search’ button without providing any specific query. This will yield in a result showing all the 25595 molecules in FlavorDB. Similarly by choosing ‘Type of Molecules’ to be ‘Natural’, you will get a list of 2254 molecules that are reported to be found in specific natural entities. All search boxes come with an autocomplete option to assist you with any query containing a string with two or more characters typed, greatly enabling the user’s ability to explore the database.
In case you would like to filter the database based on a more nuanced list of constraints, use the ‘Go To Advanced Search’ button.
Flavor Molecules Search : Results
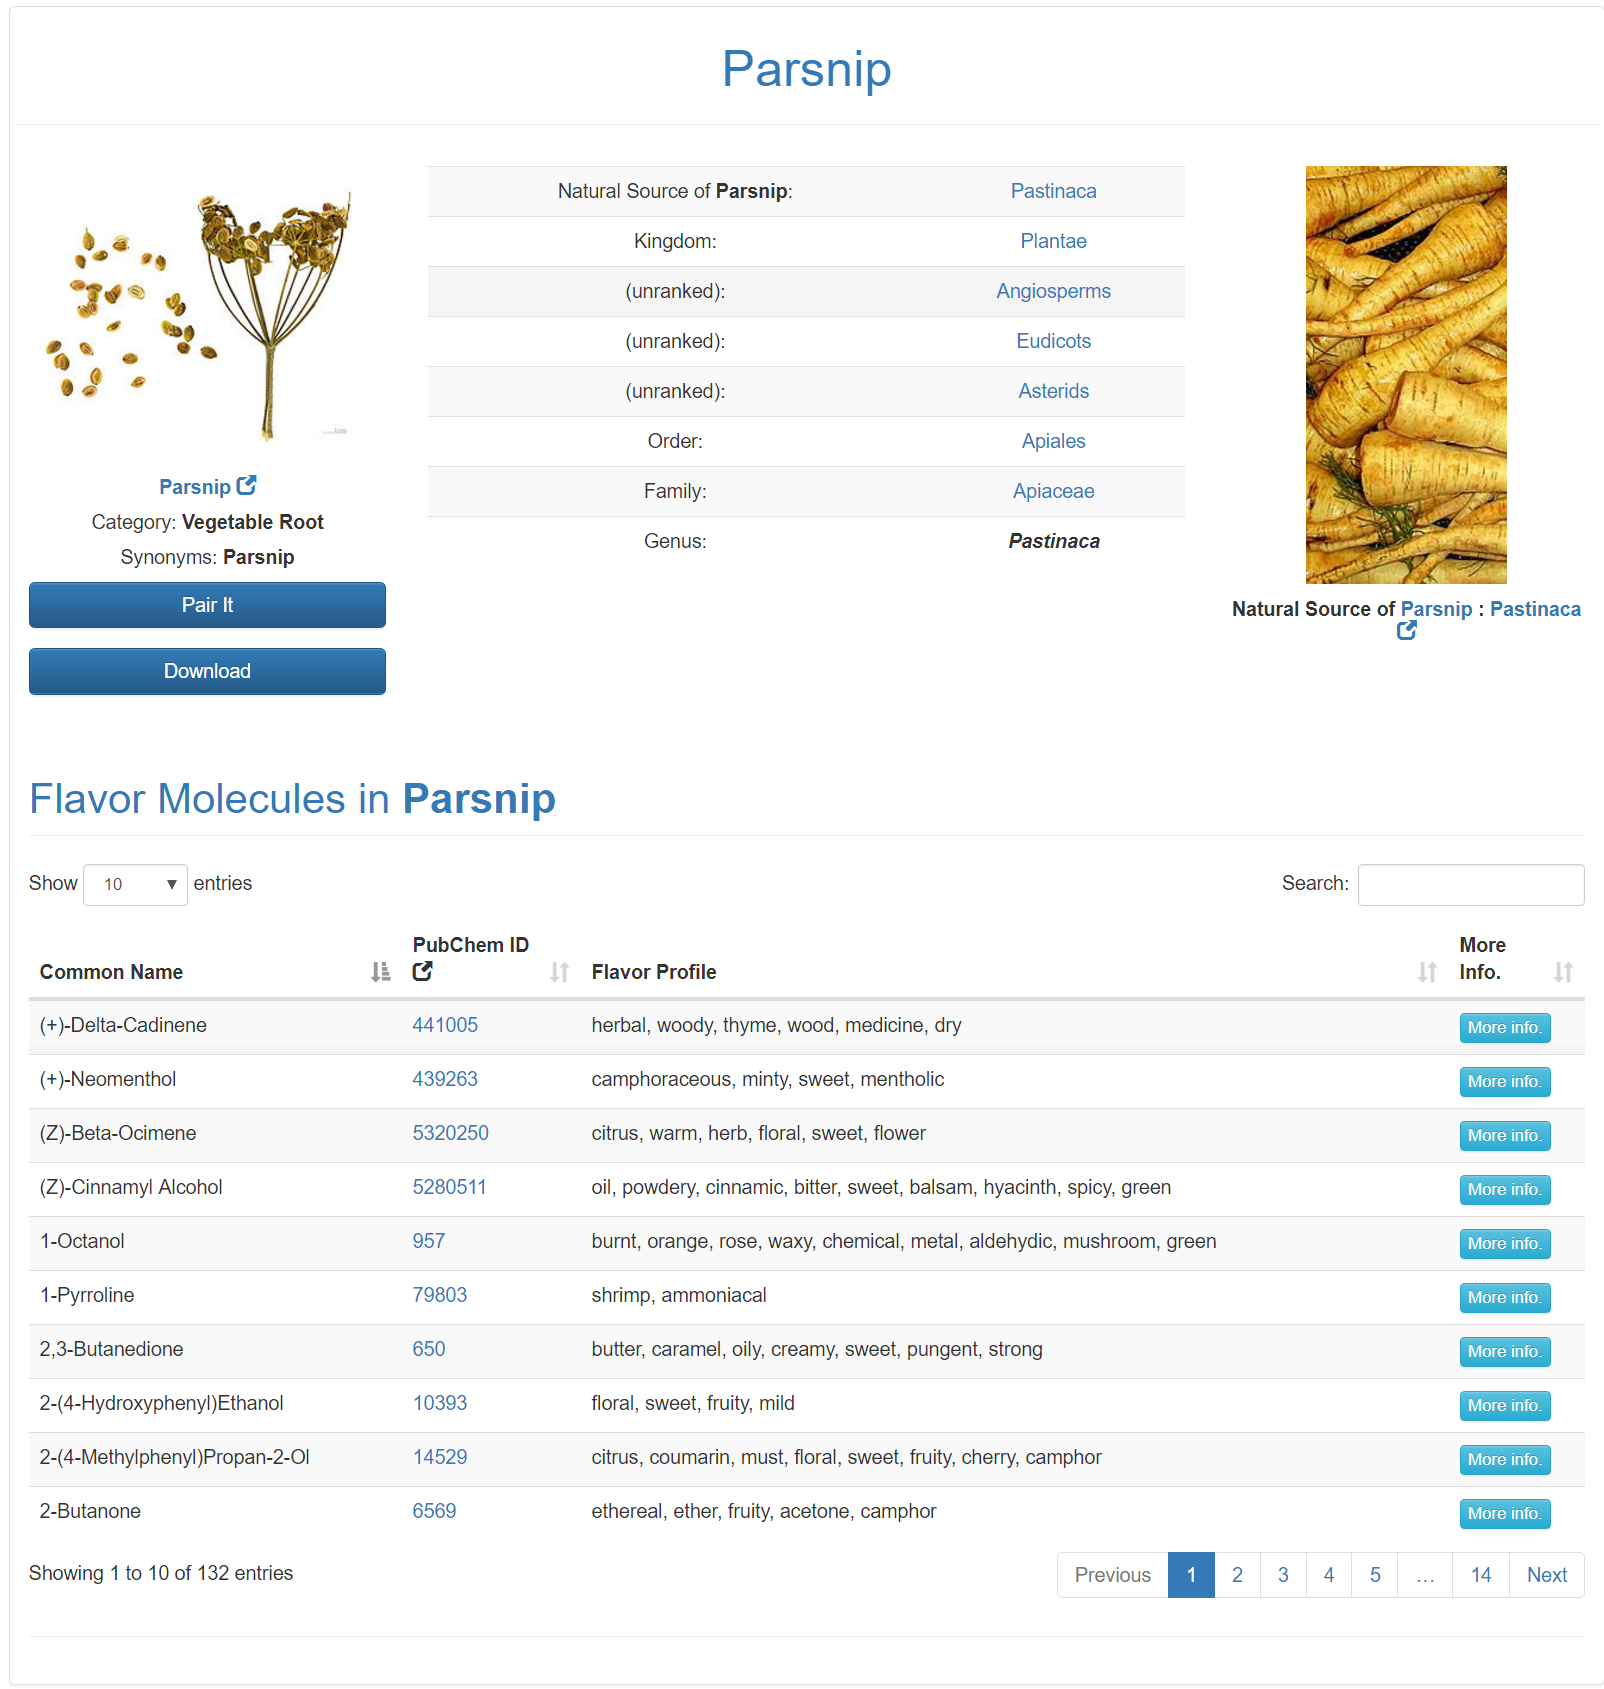
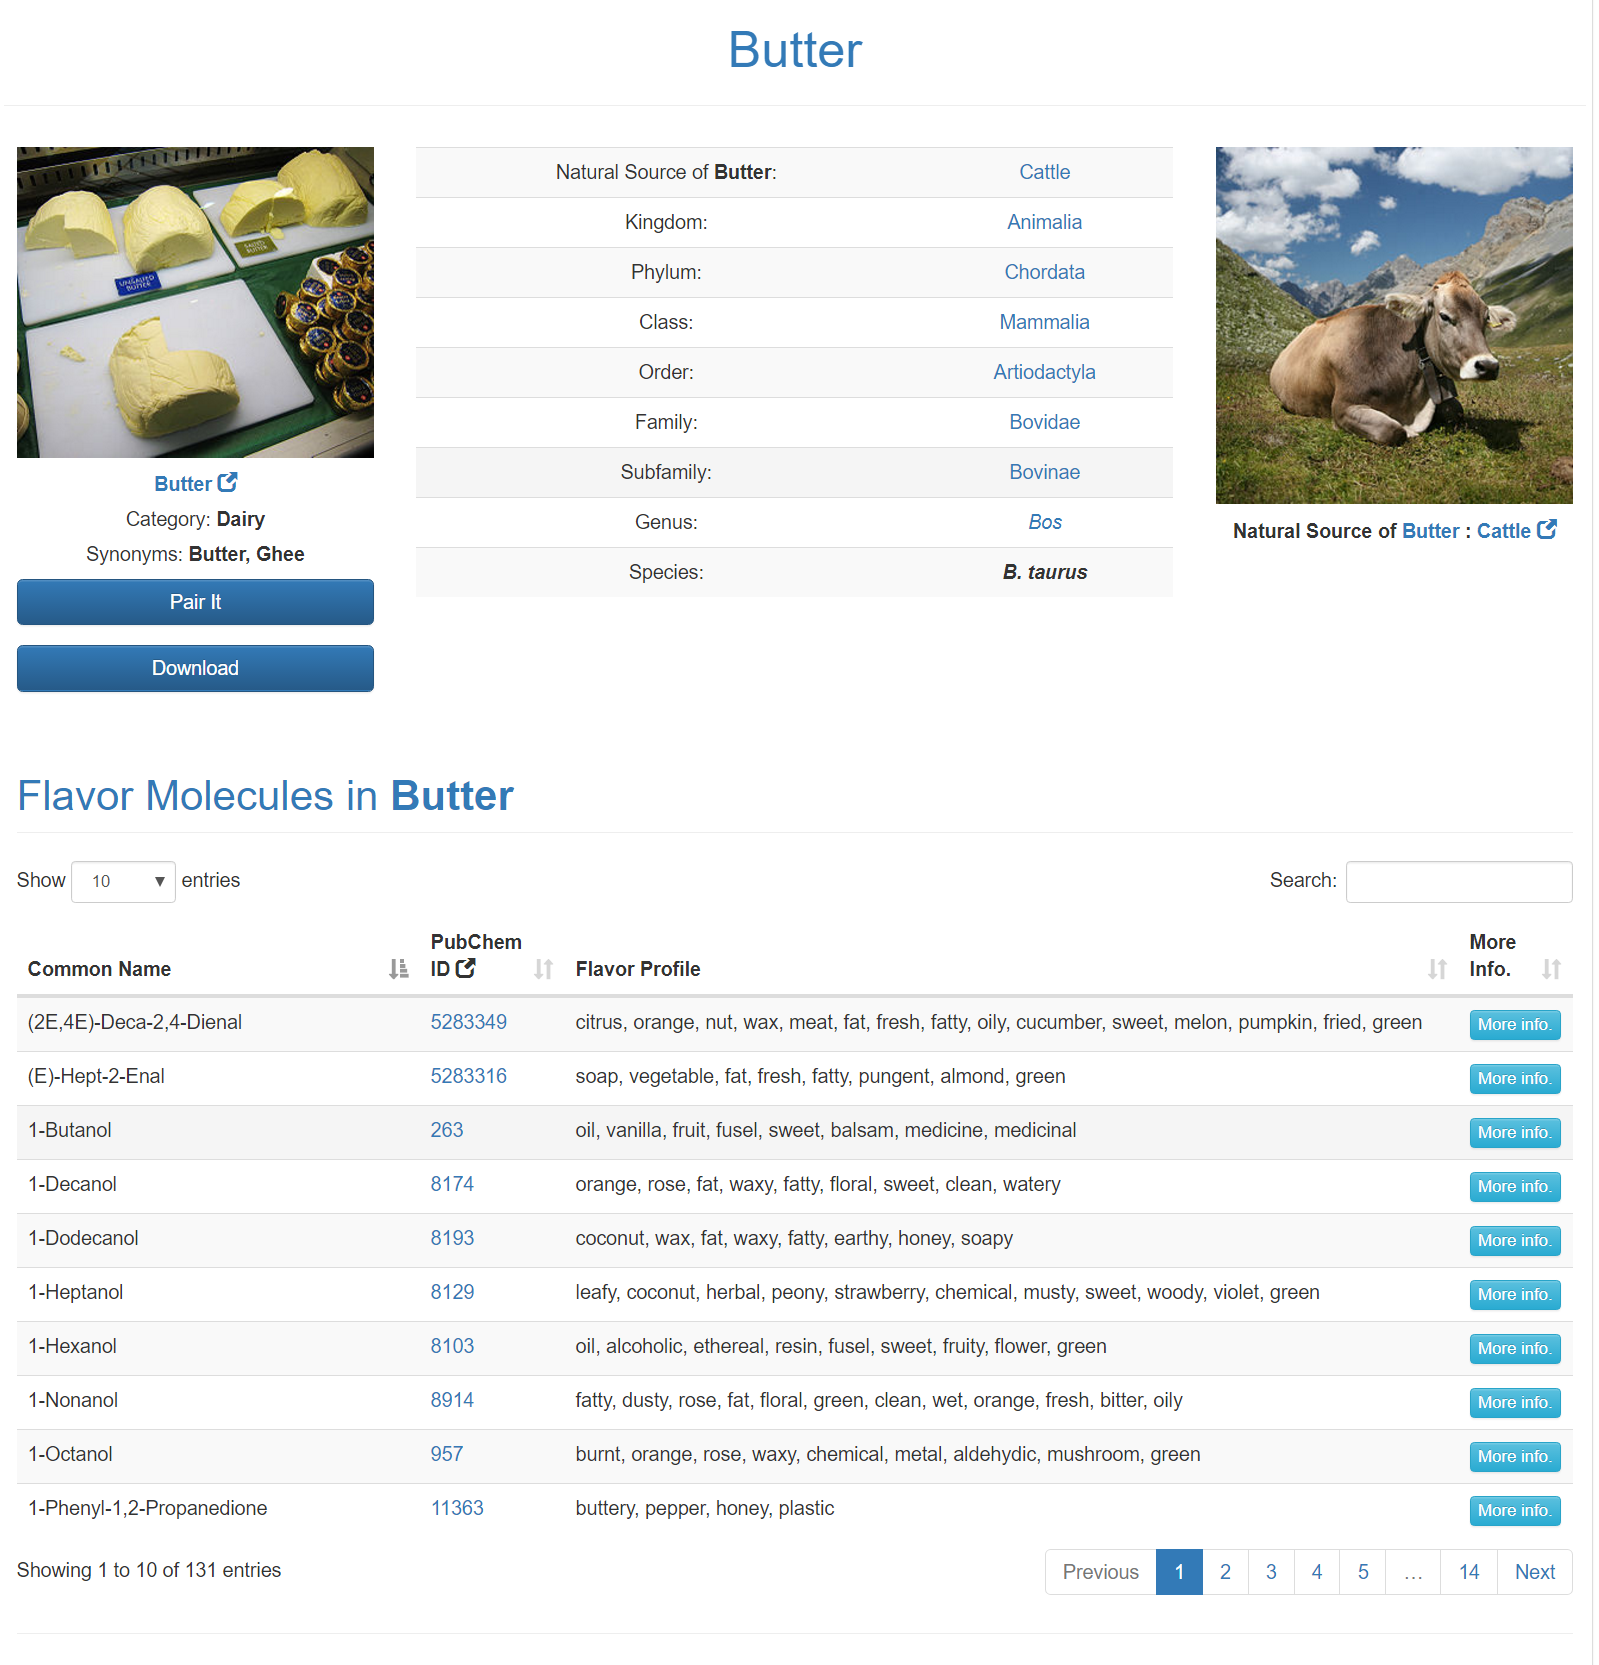
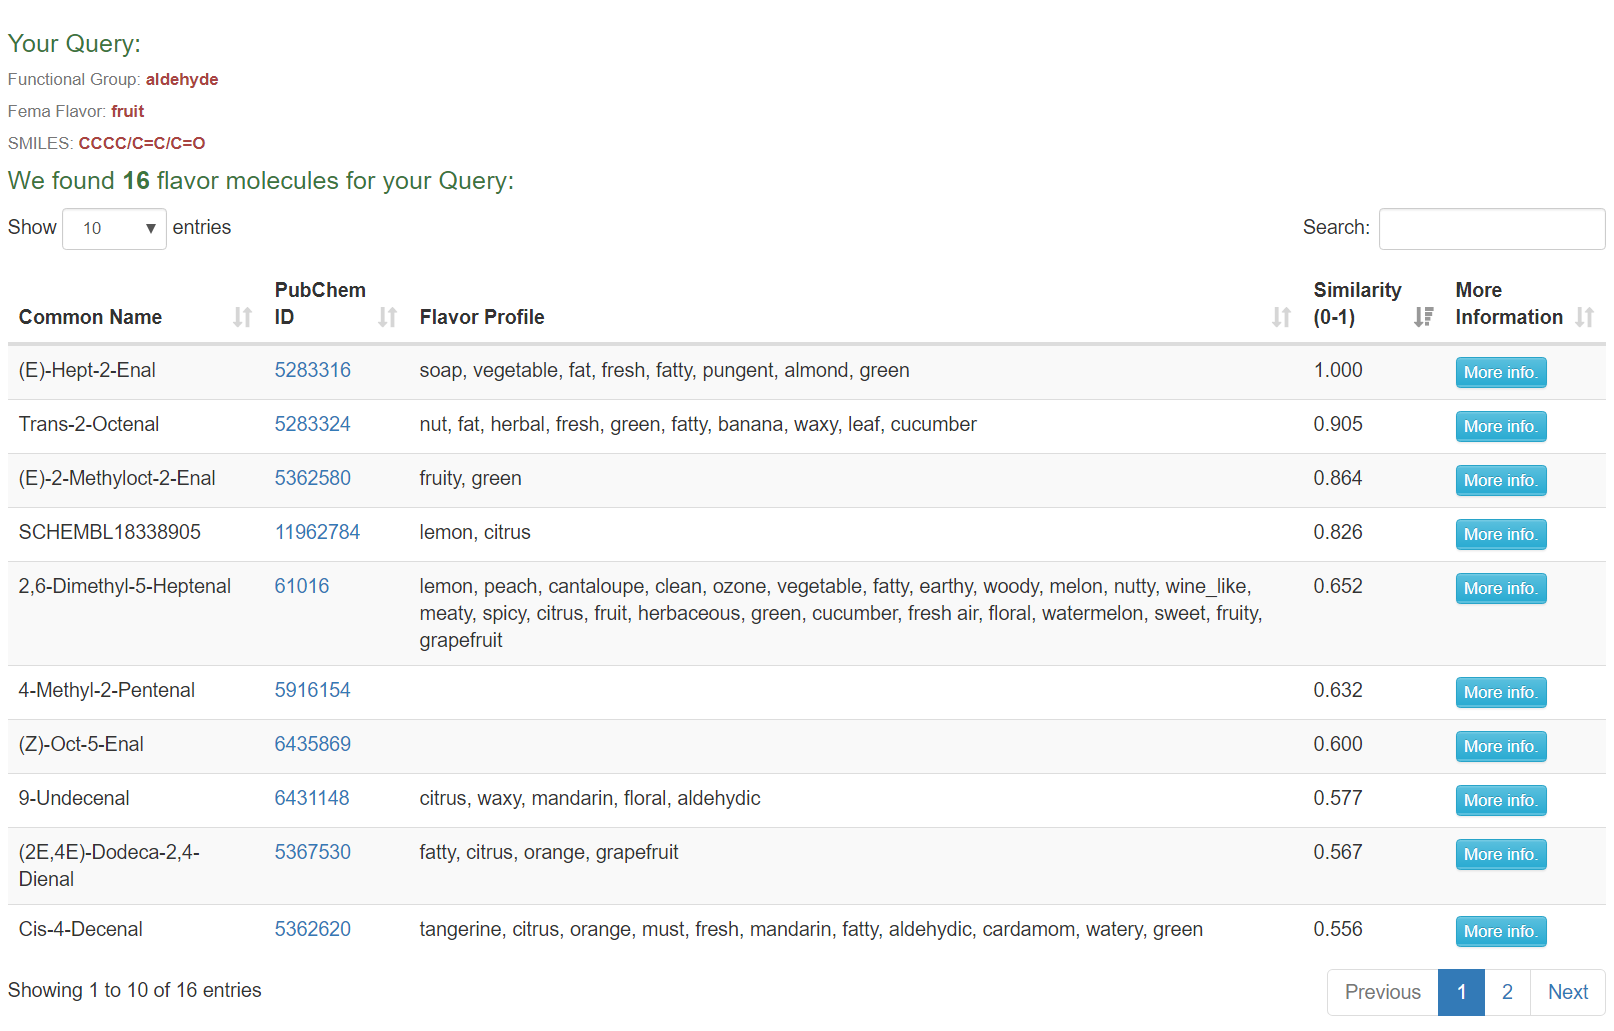
In response to the query parameter provided, a list of all matching flavor molecules will be shown. The Results page displays the query used on the top of the page. In case multiple fields are used for creating a query, the results will show molecules that satisfy all conditions. The list displays following information: Common Name, PubChem ID, FEMA Flavor Profile, Flavor Profile and ‘More Info’ button. Clicking on this button will open the ‘Molecular & Flavor Profile’ information panel for the corresponding molecules.
NOTE: In case you use the JSME tool to search based on the molecular structure, an additional column titled ‘Similarity (0-1)’ is also displayed. This refers to the percentage similarity of the result molecules to the query structure drawn. The minimum similarity threshold for displaying molecules is set at 30%.
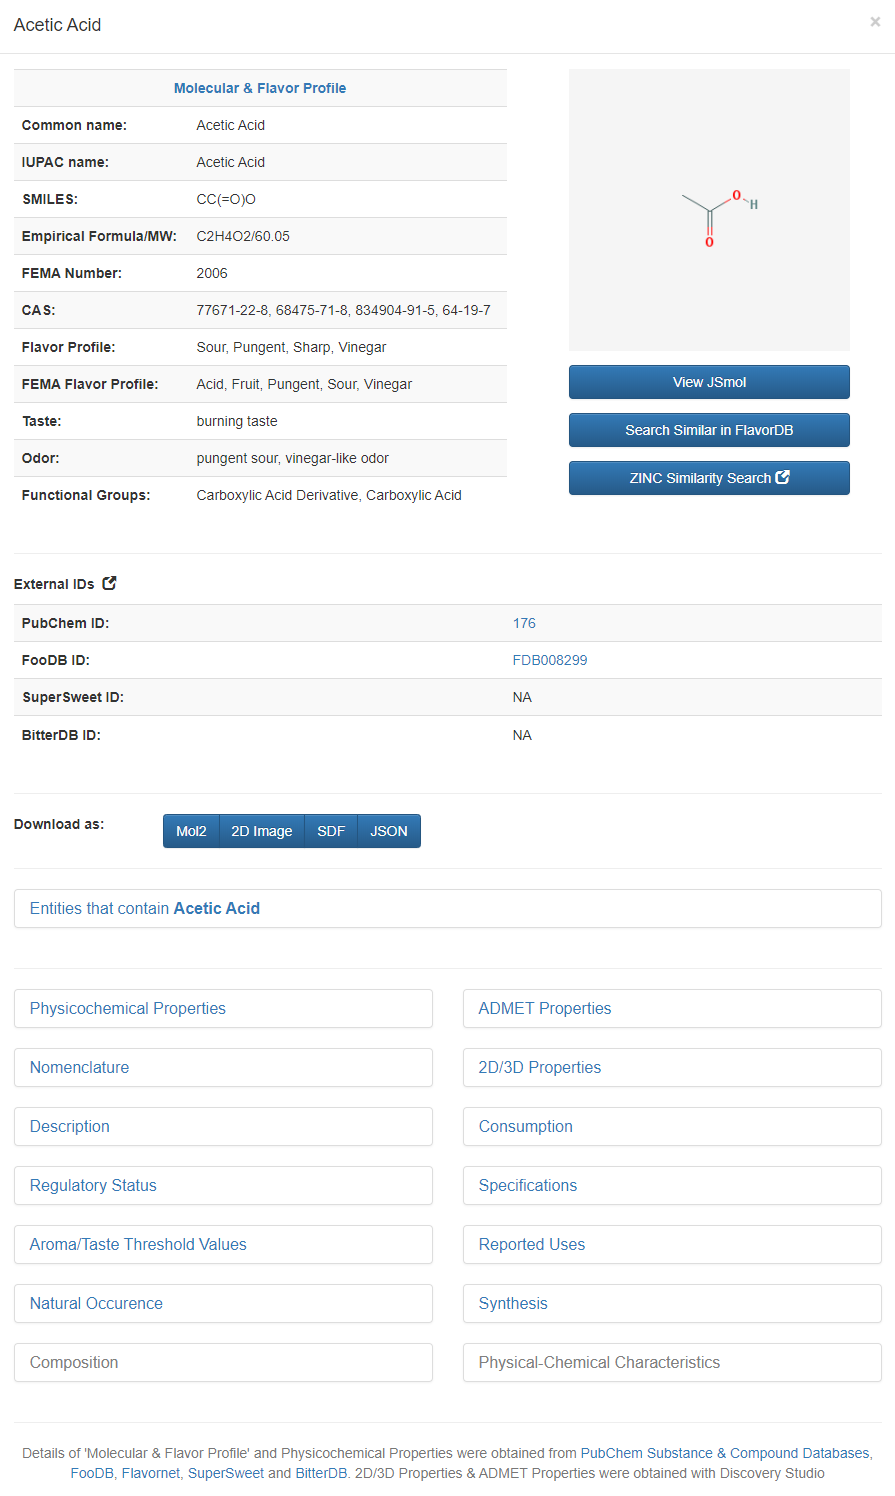
Molecular Information Panel
This panel provides ‘Molecular & Flavor Profile’ of the molecule. This includes molecular identity such as Common Name, IUPAC Name, SMILES, CAS ID, PubChem ID, FEMA Flavor Profile, FEMA Number, FLAVOR PROFILE. As part of Flavor Profile, it provides information about Taste, Odor and Functional Groups.
Further, the following collapsed sections are available, which provide following details on click: Physicochemical Properties, ADMET Properties, 2D/3D Properties of the molecule, and list of all entities that contain the flavor molecule.
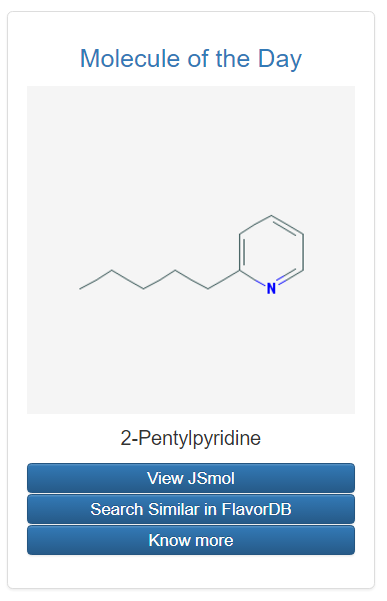
The panel also provides 2D image of the molecule, using JSmol applet, which transforms into 3D view upon clicking ‘View JSmol’ button. Further, an option is provided to download the molecule data in Mol2, SDF, 2D image, JSON format. Importantly, using structural similarity search one could either explore similar molecules within FlavorDB, or could identify commercially available molecules from ZINC.